Reference:
ossible to make labels appear when hovering over a point in matplotlib in stem plot?
Add cursor to matplotlib
Reference 1:
import matplotlib.pyplot as plt
import scipy.spatial as spatial
import numpy as np
pi = np.pi
cos = np.cos

def fmt(x, y):
    return 'x: {x:0.2f}\ny: {y:0.2f}'.format(x=x, y=y)

class FollowDotCursor(object):
    """Display the x,y location of the nearest data point.
    https://stackoverflow.com/a/4674445/190597 (Joe Kington)
    https://stackoverflow.com/a/13306887/190597 (unutbu)
    https://stackoverflow.com/a/15454427/190597 (unutbu)
    """
    def __init__(self, ax, x, y, tolerance=5, formatter=fmt, offsets=(-20, 20)):
        try:
            x = np.asarray(x, dtype='float')
        except (TypeError, ValueError):
            x = np.asarray(mdates.date2num(x), dtype='float')
        y = np.asarray(y, dtype='float')
        mask = ~(np.isnan(x) | np.isnan(y))
        x = x[mask]
        y = y[mask]
        self._points = np.column_stack((x, y))
        self.offsets = offsets
        y = y[np.abs(y-y.mean()) <= 3*y.std()]
        self.scale = x.ptp()
        self.scale = y.ptp() / self.scale if self.scale else 1
        self.tree = spatial.cKDTree(self.scaled(self._points))
        self.formatter = formatter
        self.tolerance = tolerance
        self.ax = ax
        self.fig = ax.figure
        self.ax.xaxis.set_label_position('top')
        self.dot = ax.scatter(
            [x.min()], [y.min()], s=130, color='green', alpha=0.7)
        self.annotation = self.setup_annotation()
        plt.connect('motion_notify_event', self)

    def scaled(self, points):
        points = np.asarray(points)
        return points * (self.scale, 1)

    def __call__(self, event):
        ax = self.ax
        # event.inaxes is always the current axis. If you use twinx, ax could be
        # a different axis.
        if event.inaxes == ax:
            x, y = event.xdata, event.ydata
        elif event.inaxes is None:
            return
        else:
            inv = ax.transData.inverted()
            x, y = inv.transform([(event.x, event.y)]).ravel()
        annotation = self.annotation
        x, y = self.snap(x, y)
        annotation.xy = x, y
        annotation.set_text(self.formatter(x, y))
        self.dot.set_offsets(np.column_stack((x, y)))
        bbox = self.annotation.get_window_extent()
        self.fig.canvas.blit(bbox)
        self.fig.canvas.draw_idle()

    def setup_annotation(self):
        """Draw and hide the annotation box."""
        annotation = self.ax.annotate(
            '', xy=(0, 0), ha = 'right',
            xytext = self.offsets, textcoords = 'offset points', va = 'bottom',
            bbox = dict(
                boxstyle='round,pad=0.5', fc='yellow', alpha=0.75),
            arrowprops = dict(
                arrowstyle='->', connectionstyle='arc3,rad=0'))
        return annotation

    def snap(self, x, y):
        """Return the value in self.tree closest to x, y."""
        dist, idx = self.tree.query(self.scaled((x, y)), k=1, p=1)
        try:
            return self._points[idx]
        except IndexError:
            # IndexError: index out of bounds
            return self._points[0]

fig, ax = plt.subplots()
x = np.linspace(0.1, 2*pi, 10)
y = cos(x)
markerline, stemlines, baseline = ax.stem(x, y, '-.')
plt.setp(markerline, 'markerfacecolor', 'b')
plt.setp(baseline, 'color','r', 'linewidth', 2)
cursor = FollowDotCursor(ax, x, y, tolerance=20)
plt.show()

Reference 2:
import matplotlib.pyplot as plt
import matplotlib.widgets as widgets
import numpy as np
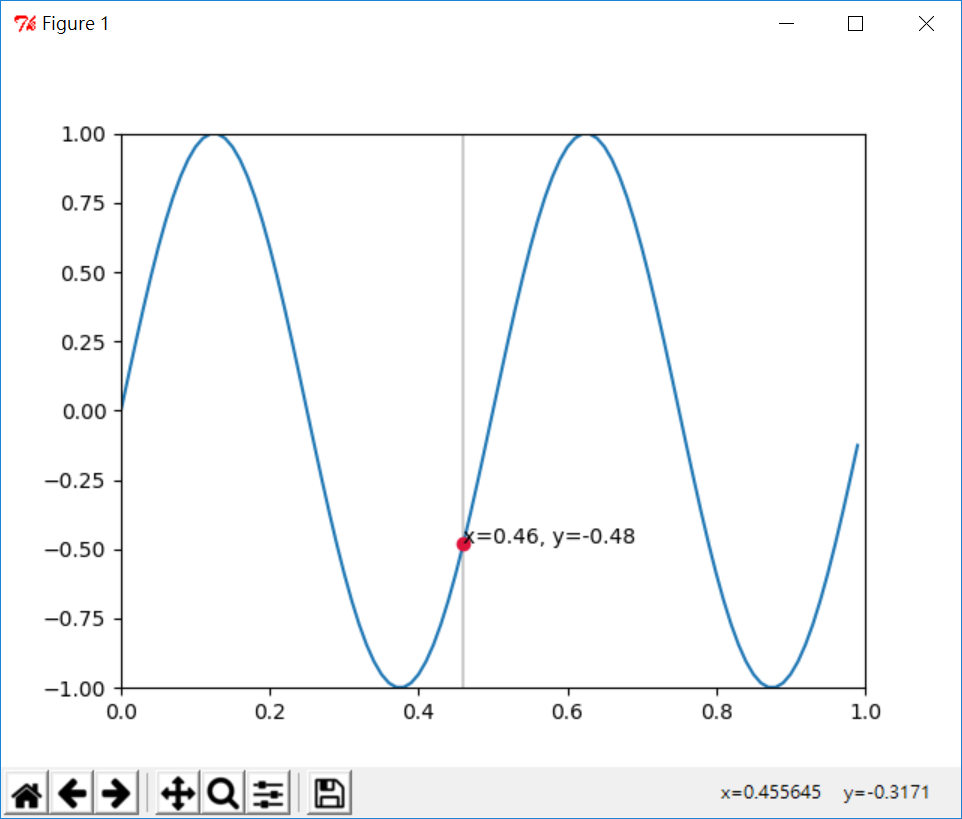
class SnaptoCursor(object):
def __init__(self, ax, x, y):
self.ax = ax
self.ly = ax.axvline(color='k', alpha=0.2) # the vert line
self.marker, = ax.plot([0],[0], marker="o", color="crimson", zorder=3)
self.x = x
self.y = y
self.txt = ax.text(0.7, 0.9, '')
def mouse_move(self, event):
if not event.inaxes: return
x, y = event.xdata, event.ydata
indx = np.searchsorted(self.x, [x])[0]
x = self.x[indx]
y = self.y[indx]
self.ly.set_xdata(x)
self.marker.set_data([x],[y])
self.txt.set_text('x=%1.2f, y=%1.2f' % (x, y))
self.txt.set_position((x,y))
self.ax.figure.canvas.draw_idle()
t = np.arange(0.0, 1.0, 0.01)
s = np.sin(2*2*np.pi*t)
fig, ax = plt.subplots()
#cursor = Cursor(ax)
cursor = SnaptoCursor(ax, t, s)
cid = plt.connect('motion_notify_event', cursor.mouse_move)
ax.plot(t, s,)
plt.axis([0, 1, -1, 1])
plt.show()
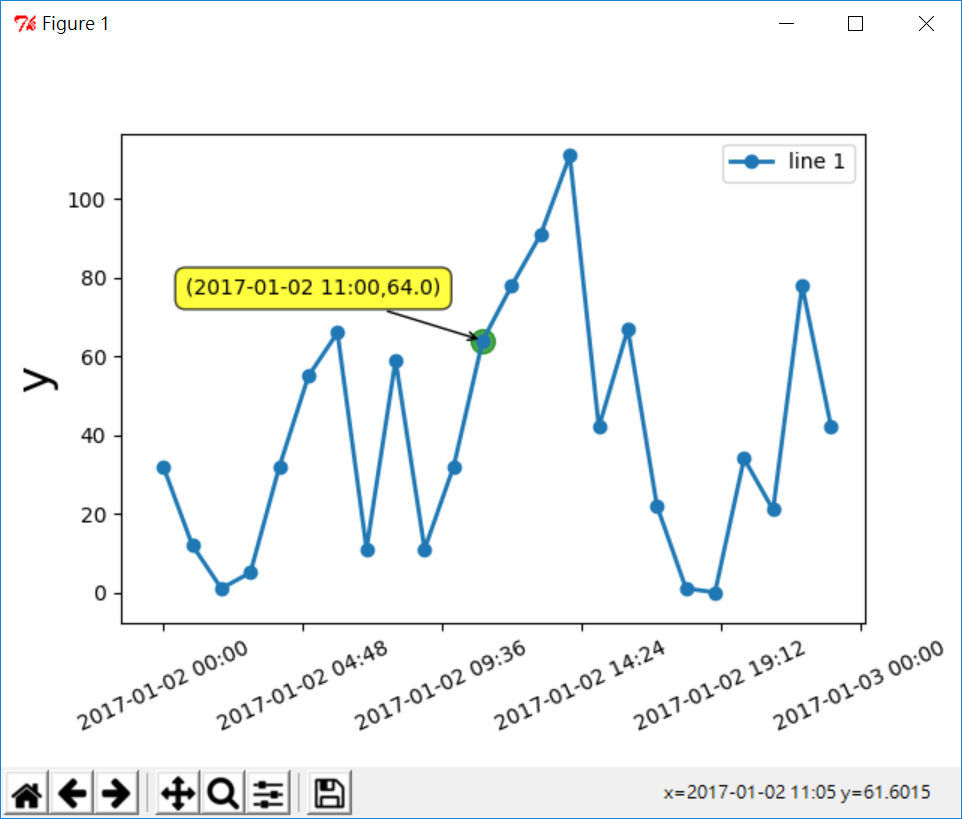
Create a example based on Reference 1.
def __call__(self, event):
    ax = self.ax
    # event.inaxes is always the current axis. If you use twinx, ax could be
    # a different axis.
    if event.inaxes == ax:
    x, y = event.xdata, event.ydata
    elif event.inaxes is None:
    return
    else:
    inv = ax.transData.inverted()
    x, y = inv.transform([(event.x, event.y)]).ravel()
    annotation = self.annotation
    x, y = self.snap(x, y)
    annotation.xy = x, y

    #covert x to date string
    date_string = num2date(x).strftime('%Y-%m-%d %H:%M')
    annotation.set_text('('+date_string+','+str(y)+')')

    self.dot.set_offsets(np.column_stack((x, y)))
    bbox = self.annotation.get_window_extent()
    self.fig.canvas.blit(bbox)
    self.fig.canvas.draw_idle()
plt.subplots_adjust(bottom=0.2)
plt.xticks( rotation=25 )
ax=plt.gca()
xfmt = md.DateFormatter('%Y-%m-%d %H:%M')
ax.xaxis.set_major_formatter(xfmt)

plt.plot(dates2,values2, '-o', lw=2, label="line 1")
ax.set_ylabel('y', size=22)

plt.legend()
FollowDotCursor(ax, dates2, values2)
plt.show()